
Your trip. Fully planned in minutes.
We’ve built a travel platform that does the thinking for you. Instead of scrolling through thousands of activities, you answer a few questions — and our smart system builds your perfect travel plan.
You can book everything in one go. No stress. No mess. Just enjoy the trip.

The Experience is Broken
Overwhelming choices, no personalization, and fragmented bookings.
Overwhelming number of similar offers across platforms
No transparent pricing or quality control
ChatGPT gives ideas, but no direct booking or curation
Lack of inspiration at the destination
Fragmented booking process → time-consuming and frustrating
Players like GetYourGuide, Viator & Klook have plateaued with near-identical offerings → Opportunity for a smart, personalized approach

One Platform. All Answers.
Smart Travel Planner
Based on user preferences & data sets → Receive optimized, curated itinerary
Gamified Experience
Family & friends can vote & share activities
Streamlined Booking
One central place for selection, planning, and all tickets

How It Works
From Input to Itinerary in Minutes
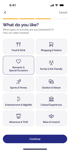
Answer a few preference-based questions

Choose from 300,000+ global activities
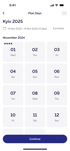
Create and visualize a complete itinerary
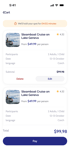
Book everything in one seamless process

Receive all vouchers/tickets in one place
Market Opportunity
A $200B Market Ripe for Disruption
Expected to double by 2035

https://dataintelo.com/report/global-travel-activities-market
https://www.verifiedmarketreports.com/product/travel-activities-market/
https://www.statsndata.org/report/travel-activities-market-82470
https://www.phocuswright.com/Travel-Research/Research-Updates/2022/The-outlook-for-travel-experiences?utm_source=chatgpt.com
Business Model
Phase 1
8% commission via Merchant API
Phase 2
30% commission via direct agency partnerships
Future
Licensing insights via proprietary Travel Intelligence API for major platforms
My Perfect Stay
Competition
Everyone Looks the Same
All focus on static listings with little user context
No dynamic itineraries, social engagement or predictive suggestions


Our Advantage
Dynamic & personalized travel planning instead of static activity feeds
Social sharing & gamification
Proprietary data = hard to copy
Built for the future with smart, behavior-based suggestions and an evolving recommendation system.
Go‒to‒Market Strategy
Built to Scale – Online & Offline
Influencer Marketing (YouTube, TikTok, Instagram Travel Creators)
Performance Marketing (SEO, SEA, Travel Advertorials)
Travel Agency Affiliates to tap into offline clientele

Team & Advisors
Built by Experts. Backed by Experience.

Marc Reineke
CEO

Salih Kayiplar
CTO

Basel Khalifa
CSO

Julian Voll
CMO

Ülgen Sarıkavak
Lead Dev

Belal Khalifa
Product Designer

Agon Selimi
Developer

Sejoon Kim
DevOps Engineer

Paul Blum
DevOps Engineer

Burkay Pehlivan
Developer

Numo Stanley
Developer

Martin Kraeter
Chief Legal Officer

Robert Ehlert
Strategic Advisor
Roadmap & Milestones
Building now – Launching Q4 2025 – Scaling from Day One.
1

Product Development
Started Building in 03/24 and will be finished 09/25
2

Pre-Seed Funding
$1M for 15%
3

GTM Launch
Q4 2025
Fundraising
Amount: $ 1,000,000
Equity: 15%
Key KPIs for MyPerfectStay
Growth KPIs
| KPI | 2026 | 2027 | 2028 | 2029 | 2030 |
|---|---|---|---|---|---|
| Total Customers | 6,000 | 13,800 | 28,140 | 56,442 | 112,932 |
| Annual Revenue (USD) | $144K | $468K | $1.51M | $3.59M | $8.3M |
| YoY Revenue Growth | – | 225% | 223% | 137% | 131% |
| % MPS Originals (30%) | 1% | 16% | 46% | 61% | 76% |
Financial KPIs
| KPI | 2026 | 2027 | 2028 | 2029 | 2030 |
|---|---|---|---|---|---|
| EBITDA | –$1.06M | –$1.43M | –$2.30M | $852K | $5.21M |
| EBITDA Margin | –733% | –305% | –152% | 24% | 63% |
| Valuation (EBITDA × 12.85) | / | / | / | $10.9M | $66.9M |
Efficiency KPIs
| KPI | Value |
|---|---|
| CAC (2026) | $100 |
| LTV (1 trip/year) | $300 × 8–30% = $24–$90 |
| LTV:CAC Ratio | 0.24–0.90 (improves with % of MPS Originals) |
| Burn Multiple (2026) | ~7.4 (Burn / Net New Revenue) |
📌 LTV improves significantly as MPS Originals grow and repeat users increase.
| Year | Customers | MPS % | Revenue | Marketing | Dev Costs | Payroll | Expenses | EBITDA | Valuation |
|---|---|---|---|---|---|---|---|---|---|
| 2026 | 6,000 | 1% | $144K | $600K | $350K | $250K | $1.20M | –$1.06M | / |
| 2027 | 13,800 | 16% | $468K | $1.2M | $420K | $275K | $1.90M | –$1.43M | / |
| 2028 | 28,140 | 46% | $1.51M | $3.0M | $504K | $303K | $3.81M | –$2.30M | / |
| 2029 | 56,442 | 61% | $3.59M | $1.8M | $605K | $333K | $2.74M | $852K | $10.9M |
| 2030 | 112,932 | 76% | $8.30M | $2.0M | $726K | $366K | $3.09M | $5.21M | $66.9M |